Task Result Analysis
For task execution results, the platform provides multi-dimensional comprehensive analysis: it supports visualization analysis of task execution processes and results, intuitively reproducing the full workflow of a task run. It also allows convenient viewing of multiple result file types, including CSV trajectory data and test reports, helping users conduct a thorough review and analysis of task results from process, data, and conclusion perspectives.
1. Task Visualization Analysis
1.1 Trigger Visualization
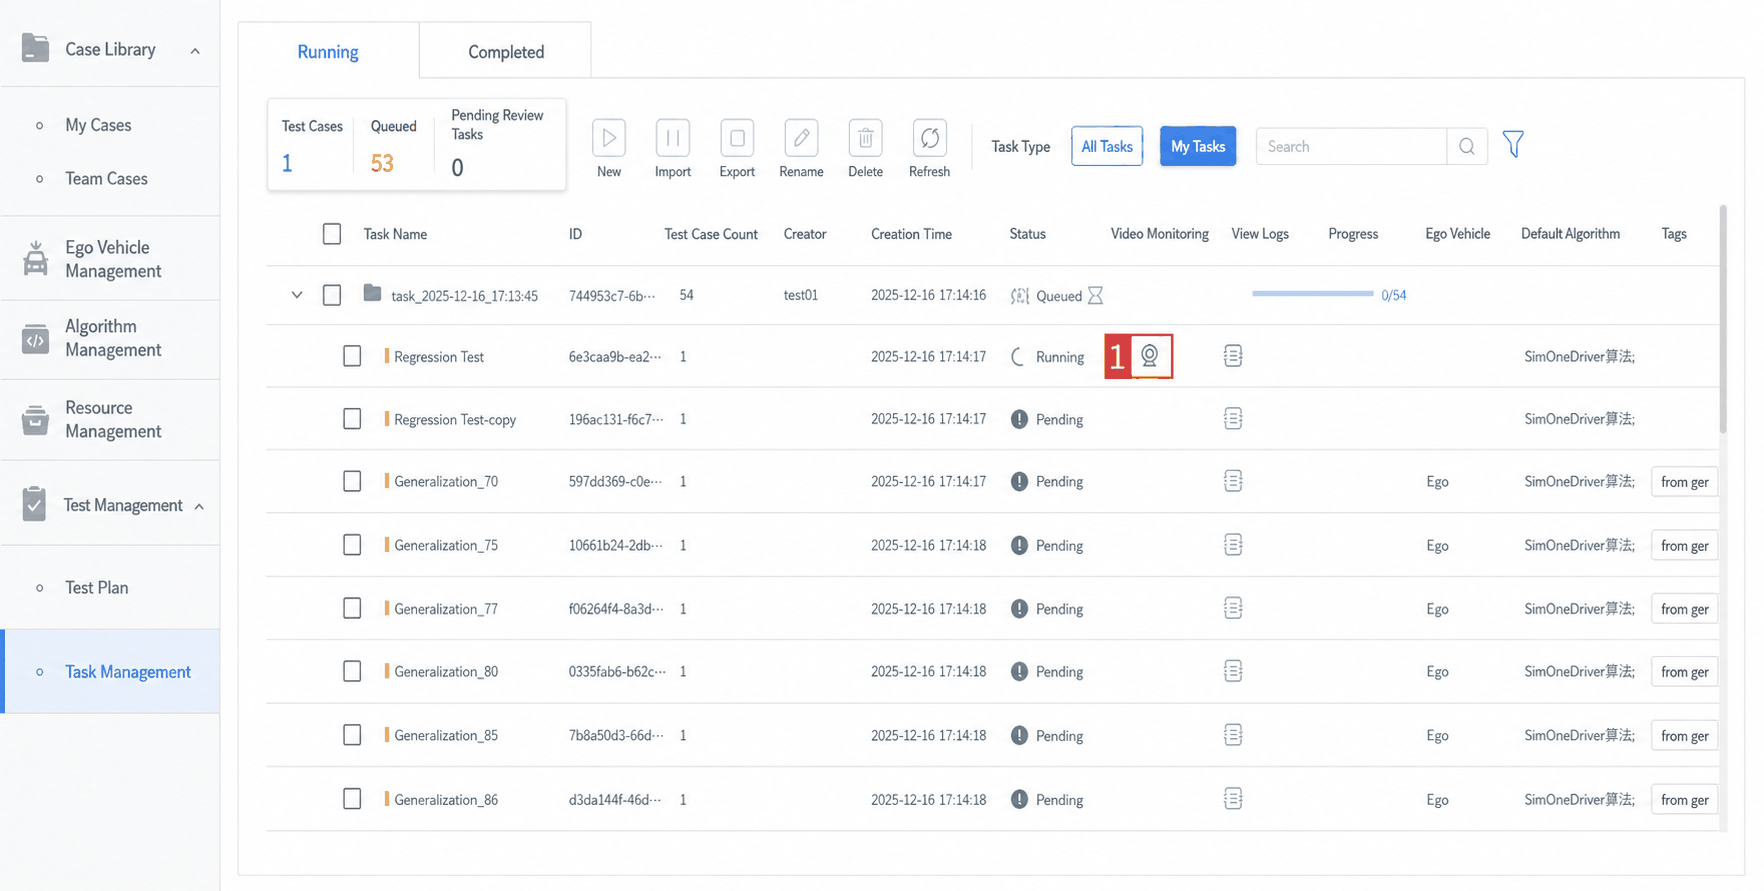
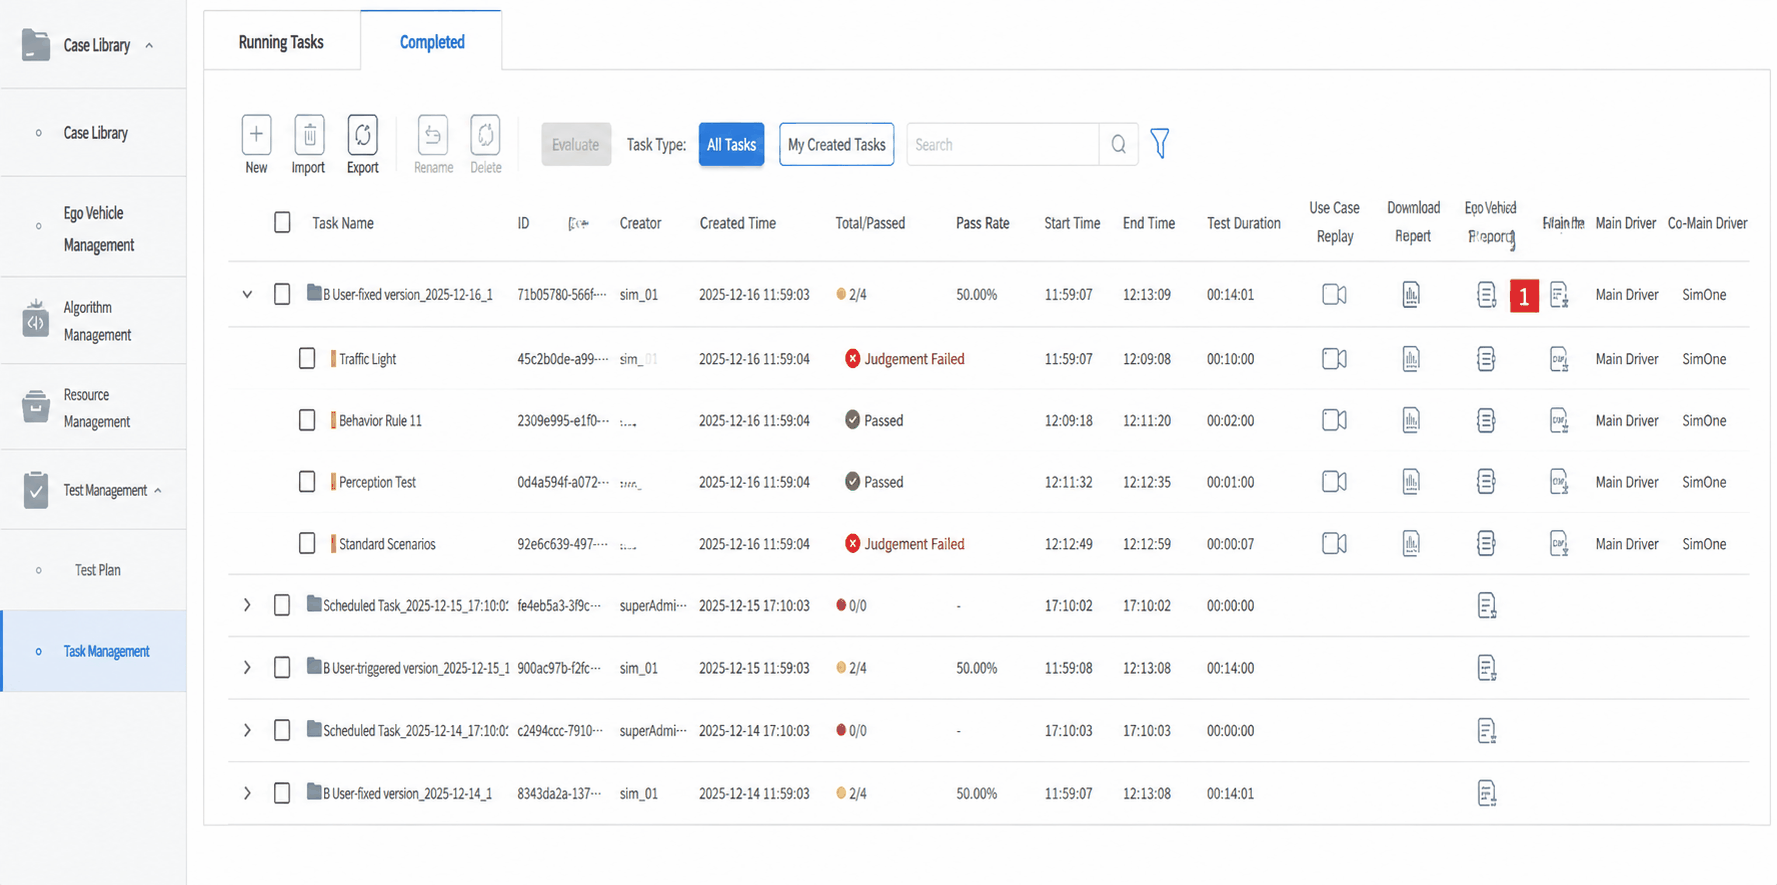
For running tasks, click the Video Monitoring icon to open the task run visualization interface.
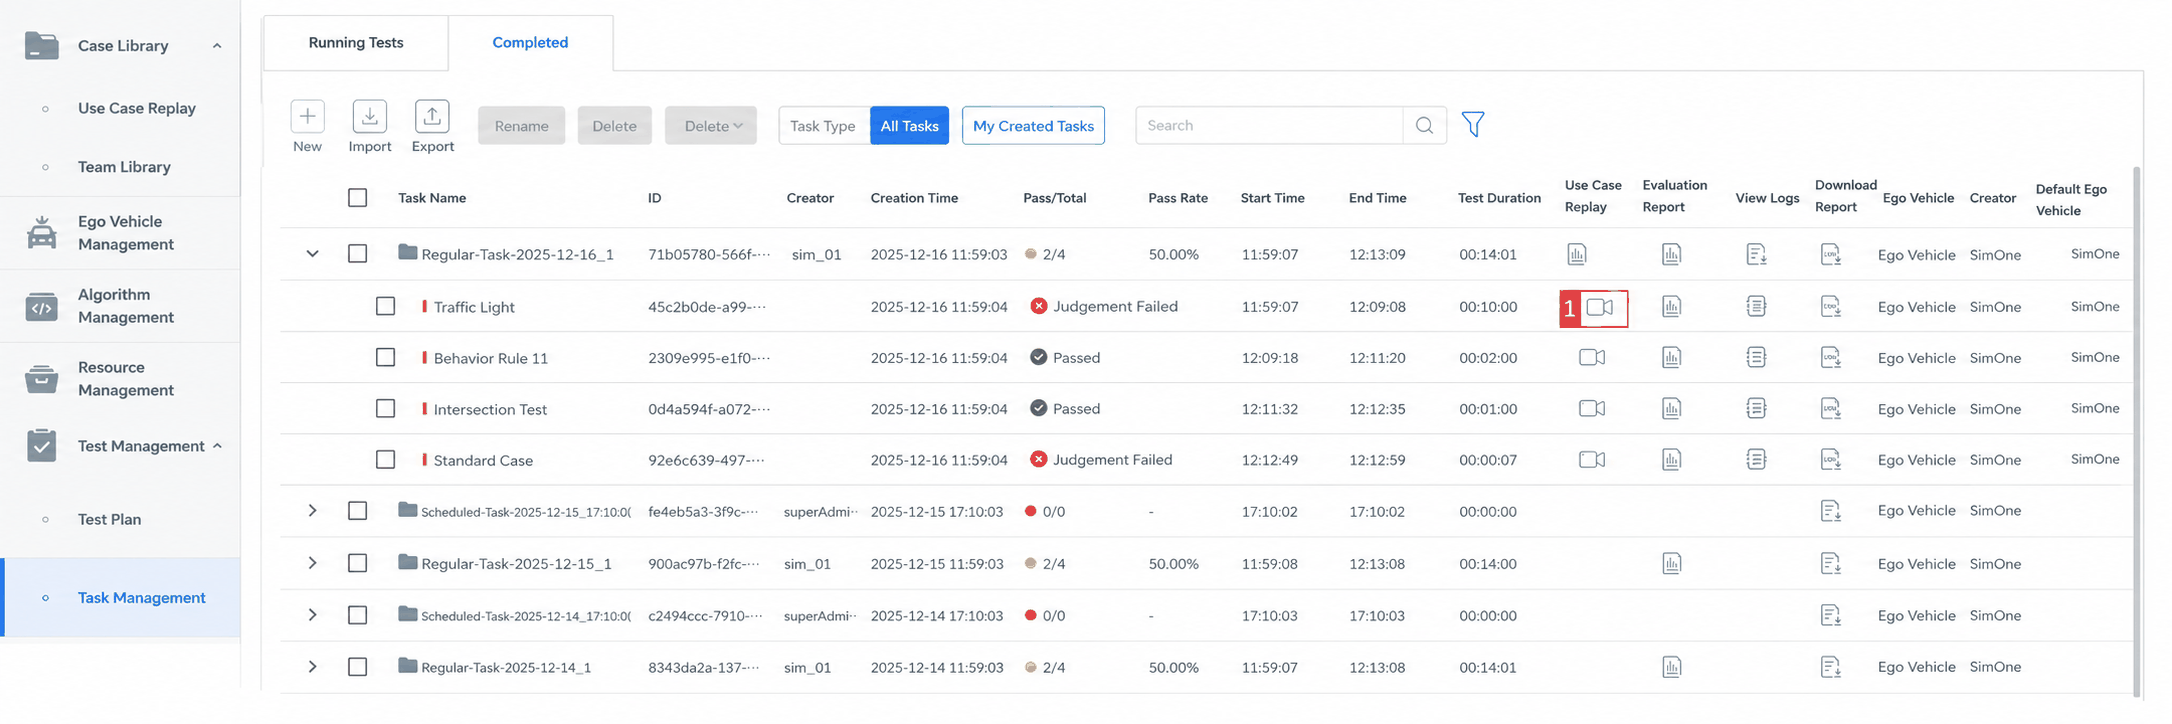
For completed tasks, click the Use Case Replay icon to open the task result visualization interface.
1.2 Visualization Interface
Warning
Visualization analysis supports two modes: High-Fidelity Rendering and Simplified Rendering. Switch between modes in Global Settings — Visualization Tool.
Team Edition — Cloud does not currently support High-Fidelity Rendering visualization.
1.2.1 High-Fidelity Rendering
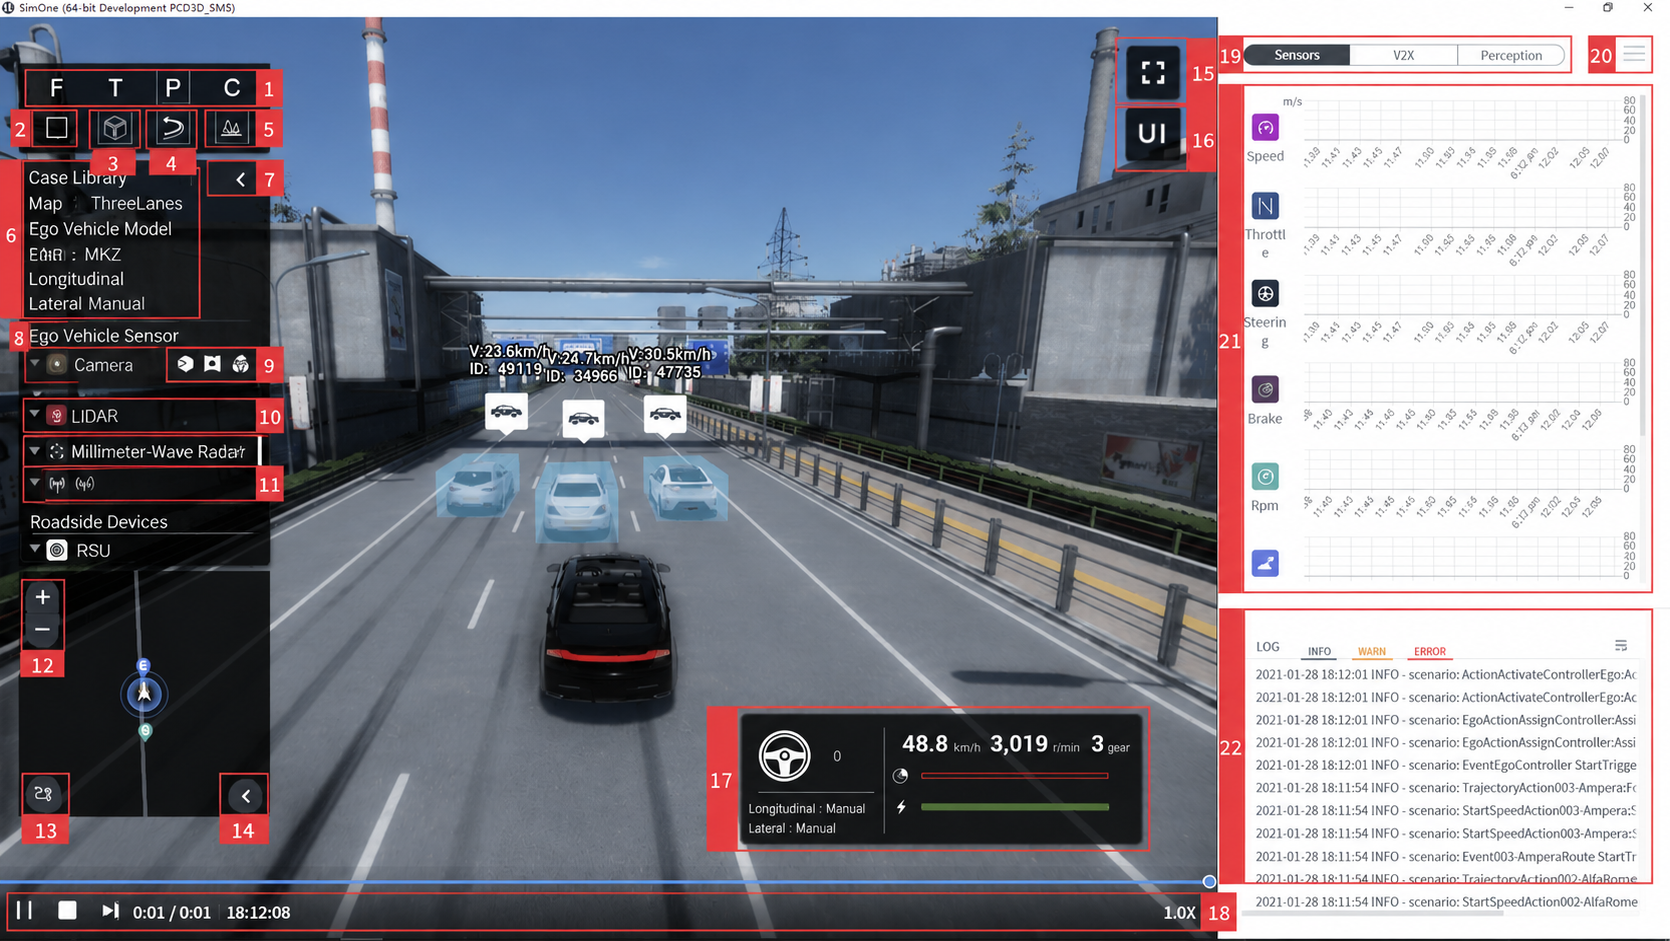
| ID | Item | Description |
|---|---|---|
| 1 | View Switching | Includes Free View, Top View, Perspective View (follow-vehicle), and Driver View. Users can switch freely between any view. In Free View, control keys adjust the observation angle; in Top View, Perspective View, and Driver View, control keys can be used to control the vehicle's forward/backward/left/right movement. |
| 2 | 2D/Bbox Display | Opponent Vehicles and elements in the test scene are displayed with 2D bounding boxes (red borders). |
| 3 | 3D/Bbox Display | Opponent Vehicles and elements in the test scene are displayed with 3D bounding boxes (3D model borders). |
| 4 | Planned Path Display | Displays the Ego Vehicle's planned path as a purple path indicator. |
| 5 | Environment Rendering On/Off | Click to show/hide Opponent Vehicles, pedestrians, non-motorized vehicles, and roadside buildings configured in the use case. |
| 6 | Use Case Basic Information | Displays the use case name, map name, Ego Vehicle type, and longitudinal/lateral controllers. |
| 7 | Collapse Menu | Click to collapse the use case details menu. |
| 8 | Ego Vehicle Sensor Basic Information | Displays the name and display mode of configured sensors. |
| 9 | Camera Sensor Image Display Mode Toggle | From left to right: depth map, semantic segmentation, instance segmentation, and test image display modes. Users can freely switch to the desired mode. |
| 10 | LiDAR Display Mode Toggle | Visualizes the LiDAR simulation effect. |
| 11 | Millimeter-Wave Radar Display Toggle | Displays the millimeter-wave radar visual effect. |
| 12 | Mini-Map Zoom | Shows the Ego Vehicle's real-time position, heading, route, and Opponent Vehicle positions during testing. Use "+" to zoom in and "−" to zoom out. |
| 13 | Mini-Map Overview Toggle | Off by default, showing the current navigation. When enabled, displays the entire route the Ego Vehicle has traveled. |
| 14 | Collapse Mini-Map | Click to collapse the mini-map. |
| 15 | Observer Window Maximize | Maximizes the left Observer window, hiding the real-time parameter changes for sensors and the test log. |
| 16 | Show/Hide UI Controls | Click to show/hide all UI controls on the Observer display interface. |
| 17 | Ego Vehicle Driving Test Data | Includes real-time steering wheel feedback, vehicle control system name, steering wheel data, speed, RPM, gear, and brake data. |
| 18 | UE Visualization Window Process Control | From left to right: Pause, Stop, Next Frame, Elapsed Time, Total Duration, Current Time, and Playback Speed. |
| 19 | Real-Time Parameter Panel Toggle | Includes Sensors, V2X, and Perception tabs. |
| 20 | Data Filter | Click to open a filter dialog where users select the data types displayed below. |
| 21 | Information Display | Switch content using the Tab menu at the top. Sensors shows Ego Vehicle sensor dynamics parameters over time. V2X shows various event information. Perception shows the Ego Vehicle's perception and decision-making information. |
| 22 | Test Log List | Displays test log information during the test, including INFO, WARN, and ERROR levels. |
1.2.2 Simplified Rendering
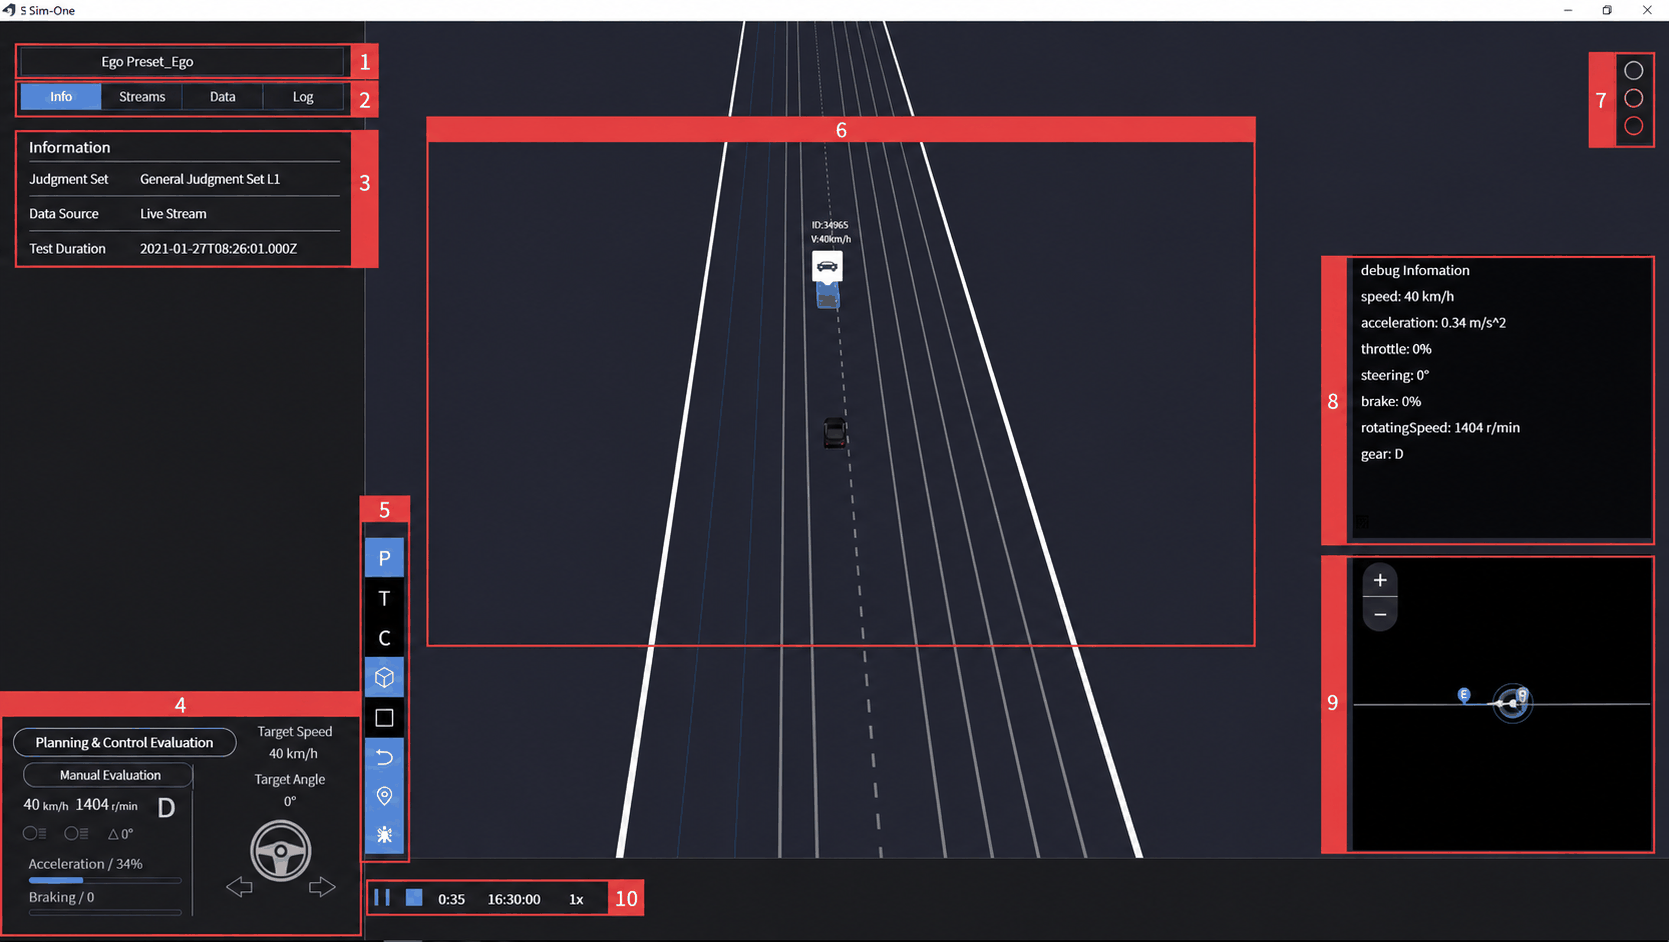
| ID | Item | Description |
|---|---|---|
| 1 | Observer View Object Toggle | Selects the observer perspective; defaults to the Ego Vehicle, but can be switched to an Opponent Vehicle view. |
| 2 | Information Display Bar | Click to switch to another channel. |
| 3 | Information Display Area | Defaults to Info, showing use case information. |
| 3.1 | Streams: shows Ego Vehicle-related data. | |
| 3.2 | Data: split into Sensors and V2X. Sensors shows Ego Vehicle data charts; hover over any point on a chart to read the value. V2X shows V2V, V2I, and other event information. | |
| 3.3 | Log: shows log information; defaults to all types. Click the title to toggle show/hide. | |
| 4 | Ego Vehicle Information Display Area | Defaults to Info, showing use case information. |
| 5 | Display Toolbar | From top to bottom: P (follow-vehicle view), T (top view), C (driver view), 3D Bounding Box toggle, 2D Bounding Box toggle, Trajectory toggle, Mini-Map toggle, Debug toggle. |
| 6 | Use Case Test Visualization Area | Displays the HD map, Ego Vehicle, Opponent Vehicles, pedestrians, and other dynamic and static objects. |
| 7 | Traffic Light | Displays the traffic light status at the next intersection. |
| 8 | Debug Info Bar | Displays instantaneous data related to the Ego Vehicle. |
| 9 | Mini-Map | Same as the mini-map in the UE Observer. |
| 10 | Process Control | From left to right: Pause, Stop, Elapsed Time, Total Duration, and Playback Speed. |
2. CSV Trajectory Data Analysis
For completed tasks, click the Download CSV icon to obtain the dynamic trajectory data recorded during task execution, helping users analyze the motion of objects during task operation.
2.1 CSV Data Sample
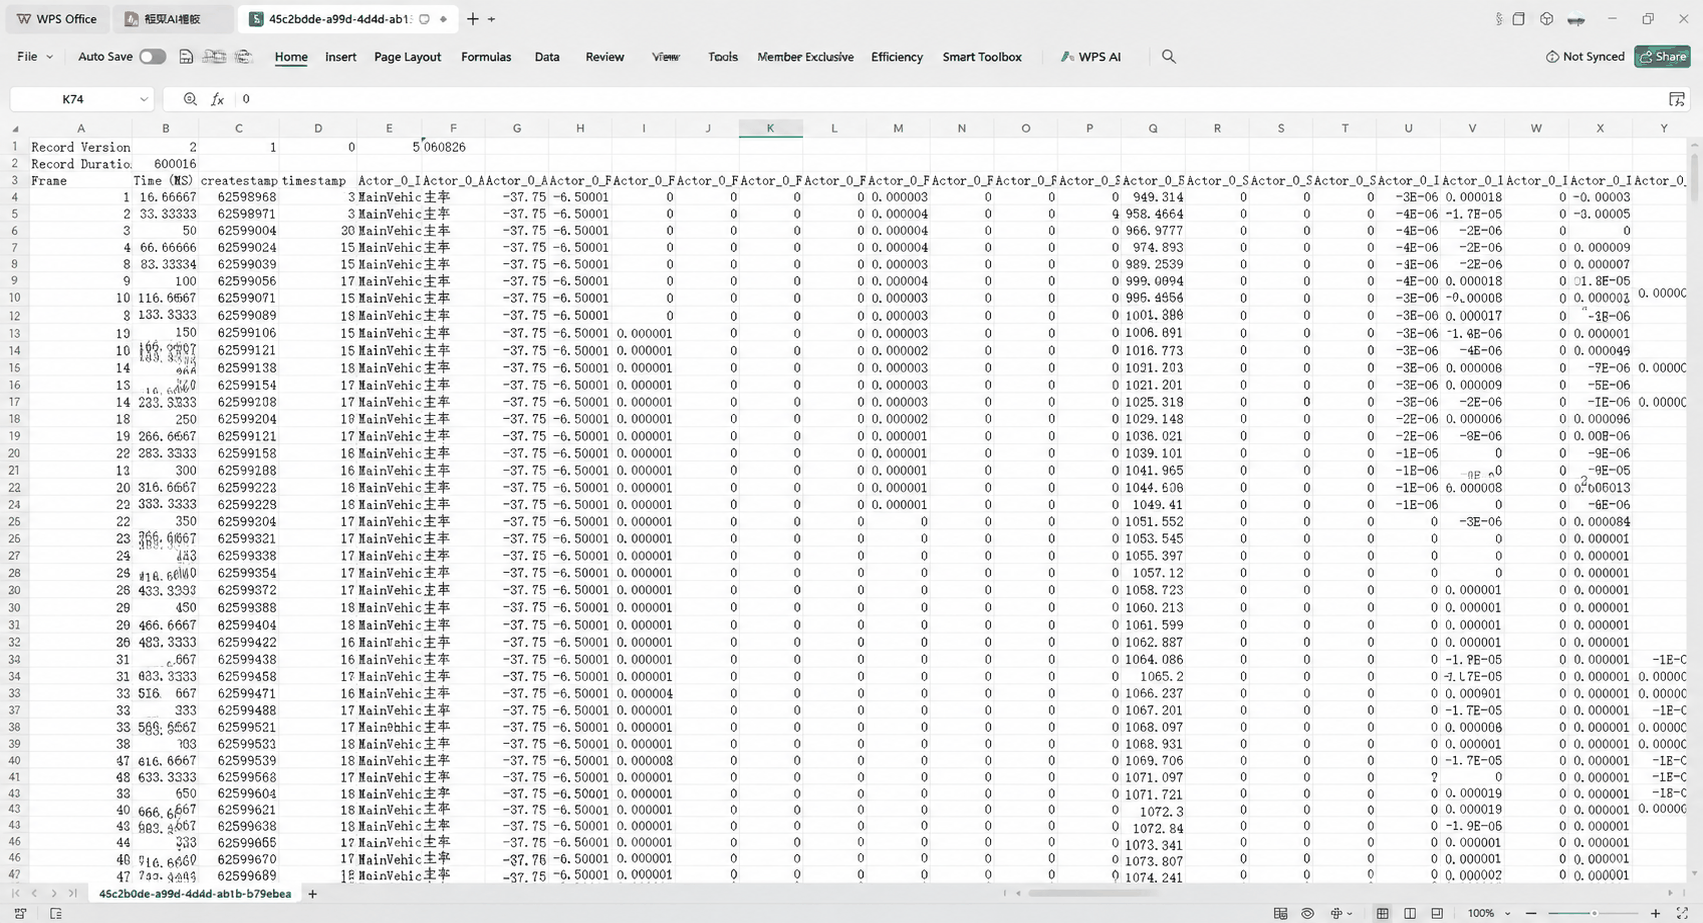
2.2 CSV Format Description
| Field | Description | Unit |
|---|---|---|
| Frame | Frame number | — |
| Time(MS) | Timestamp | Milliseconds |
| Type | Object type | — |
| PosX(M) | Position X-axis | Meters |
| PosY(M) | Position Y-axis | Meters |
| PosZ(M) | Position Z-axis | Meters |
| RotX(R) | Rotation X-axis | Radians |
| RotY(R) | Rotation Y-axis | Radians |
| RotZ(R) | Rotation Z-axis | Radians |
| Speed(M/S) | Speed | Meters/second |
| Throttle(P) | Throttle | 0–1 |
| Steering(P) | Steering angle | 0–1 |
| Brake(P) | Brake | 0–1 |
| RPM | Engine speed | RPM |
| Gear | Gear | — |
| LinearVelocityX(M/S) | Linear velocity X-axis | Meters/second |
| LinearVelocityY(M/S) | Linear velocity Y-axis | Meters/second |
| LinearVelocityZ(M/S) | Linear velocity Z-axis | Meters/second |
| LinearAccelerationX(M/S2) | Linear acceleration X-axis | Meters/second² |
| LinearAccelerationY(M/S2) | Linear acceleration Y-axis | Meters/second² |
| LinearAccelerationZ(M/S2) | Linear acceleration Z-axis | Meters/second² |
| AngularVelocityX(R/S) | Angular velocity X-axis | Radians/second |
| AngularVelocityY(R/S) | Angular velocity Y-axis | Radians/second |
| AngularVelocityZ(R/S) | Angular velocity Z-axis | Radians/second |
| AngularAccelerationX(R/S2) | Angular acceleration X-axis | Radians/second² |
| AngularAccelerationY(R/S2) | Angular acceleration Y-axis | Radians/second² |
| AngularAccelerationZ(R/S2) | Angular acceleration Z-axis | Radians/second² |
| WheelSpeedFrontLeft(M/S) | Front-left wheel speed | Meters/second |
| WheelSpeedFrontRight(M/S) | Front-right wheel speed | Meters/second |
| WheelSpeedRearLeft(M/S) | Rear-left wheel speed | Meters/second |
| WheelSpeedRearRight(M/S) | Rear-right wheel speed | Meters/second |
3. View the Test Report
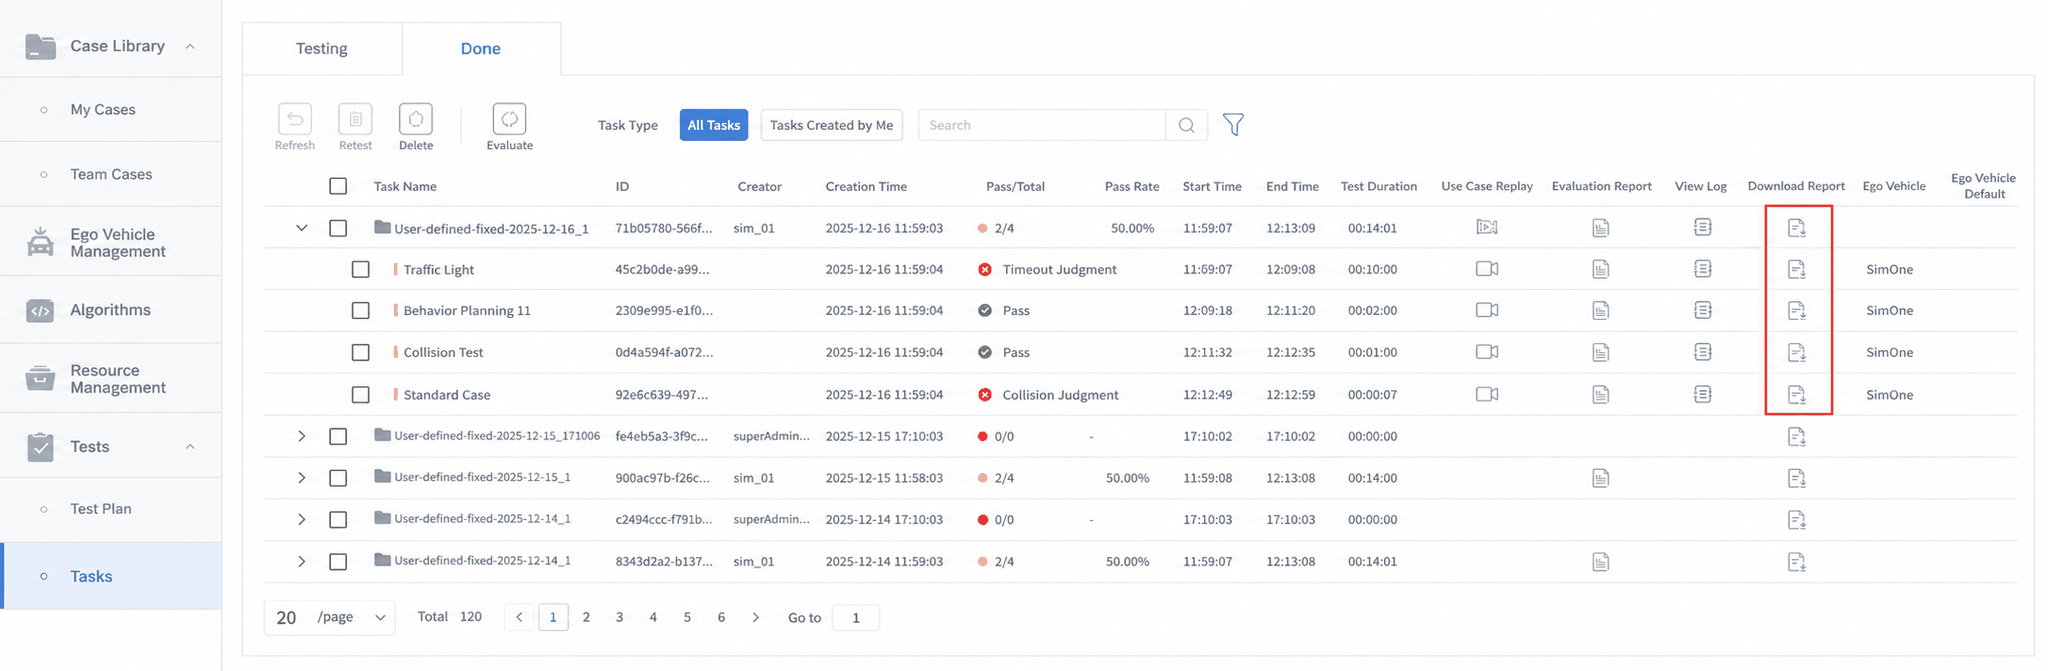
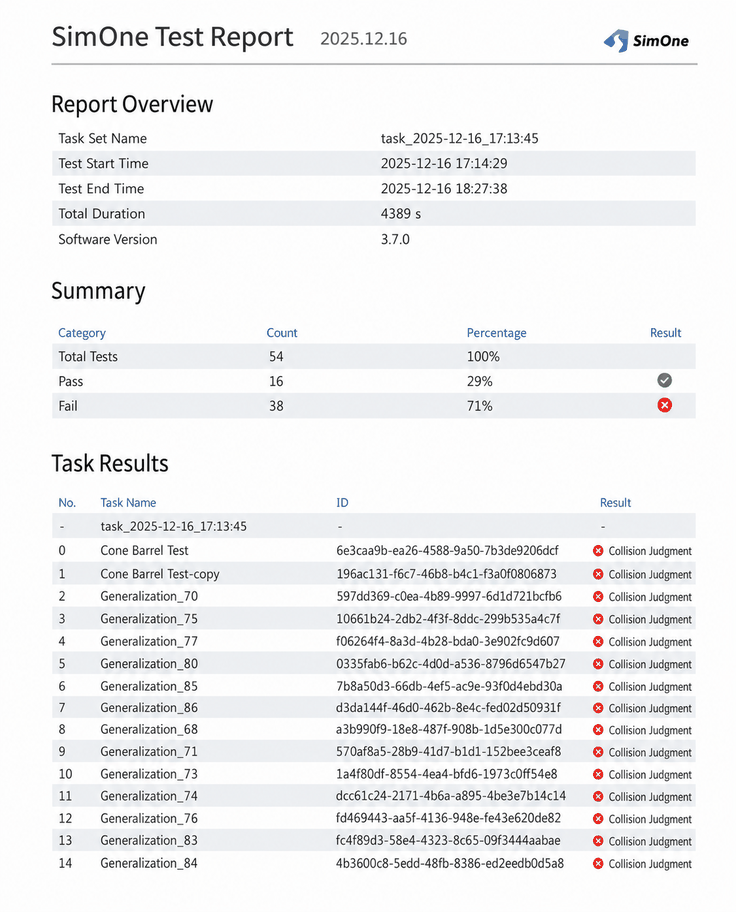
For completed tasks — whether individual tasks or task sets — results can be reviewed efficiently. For a task set, click Download Report to obtain the test report for the entire task set with one click. The report includes:
- Aggregate result information for all tasks under the task set;
- Detailed report information for each individual task.